Beware of sensible information leakage when doing HTTP actions inside Logic Apps

Using Azure Logic Apps for any sorts of workflow automation or process orchestration is quite comfortable and easy, especially since almost any HTTP-related task consists of nothing more than adding some action steps to the execution flow.

But have you ever had a closer look to the actual HTTP request data which is finally sent over the wire in the background by the Logic App engine? You would be surprised what additional informations (=metadata) are automatically included to the final HTTP request. Let’s have a look on an example.

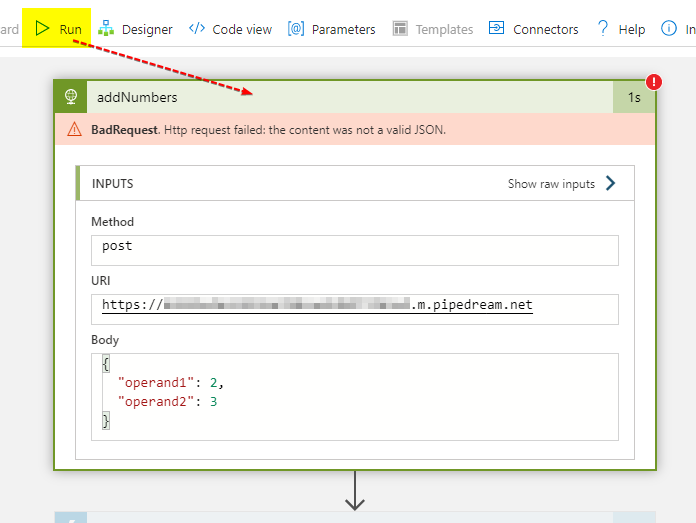
I just created an empty Logic App and added an HTTP action calling test endpoint over at Pipedream. Then I did manually invoke it using the Run command. Just ignore the BadRequest error response, it doesn’t matter here.

The final HTTP request sent by the Logic App engine over the wire then looks like this:

Additional HTTP headers automatically added by Logic App engine to outgoing request

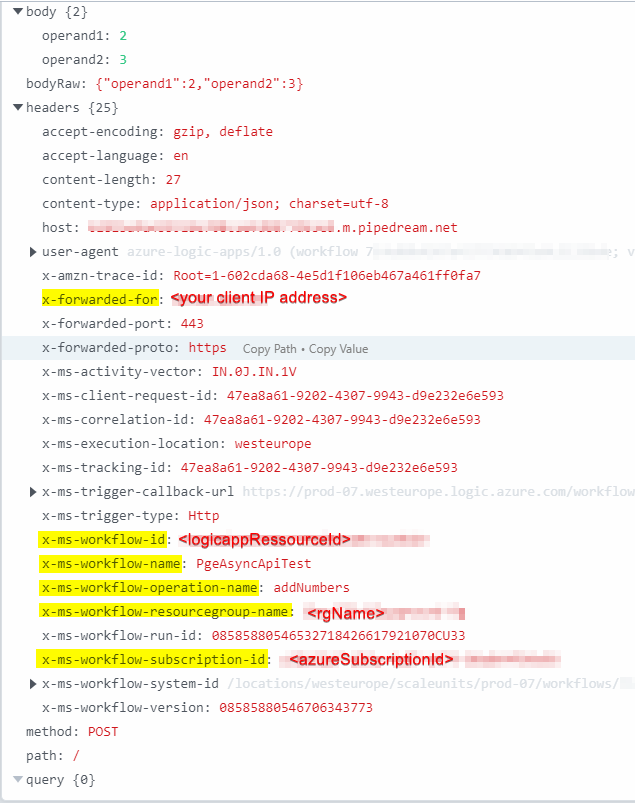
As you can see, there are a lot of platform-internal and informations leaking through to the receiving party. Including sensible informations like

  • the client machines IP address from which the Logic App execution was triggered from
  • the Azure subscription id
  • the Logic App ressource id, the ressource group name in which it is contained in
  • the Logic App’s name as well the name of the HTTP action that caused the HTTP request

While this kind of (unencrypted) metadata exchange might be very helpful or even required in certain Azure solution scenarios, it must be assured that this happens in a secure environment where every receiving party is trusted. However, this is NOT the case when HTTP requests are going out to any external service which is operated by a 3rd party.

Conclusion

When using HTTP actions in Logic Apps, ask yourself if the receiving party is trustworthy and if the information leakage via proprietary HTTP headers shown above is tolerable. Otherwise, make sure to filter out the questionable X-* headers from the resulting request using for example a proxy service or specifiying outgoing policies on an Azure API Management ressource.

First impression of Application Insights adapter for NLog

Recently I setup a prototype of a WCF server application where Azure Application Insights is used for capturing runtime telemetry data as well as storage backend for operational logging data. I choose NLog as logging framework and the Microsoft.ApplicationInsights.NLogTarget adapter for Application Insights which is still actively maintained by Microsoft (Github).

The adapter configuration was straight forward and did follow certain best practices (f.e. using dedicated config files like NLog.config or AppInsights.conf). Then I was curious about how the adapter is handling structured logs and if it has a bulking strategy for submitting multiple log enties.

Bulked submission of log enties

So let’s spin up Fiddler and see how theMicrosoft.ApplicationInsights.NLogTarget adapter submits multiple logs. As expected, it combines multiple entries per HTTP request sent to the AI webservice. Check #1 ✅

I did invoke a function 2 times, each time generating 4 log messages

Structured log data

Very important for my evaluation was support for the Message Templates specification. It’s “a format for conveniently capturing and rendering structured application log events“. By capturing and storing logging data from your systems in a semi-structured mannor, you lay the foundation for doing specific reportings or setting up automated monitoring rules without having to munge any unstructured text messages first using a myriad of regular expressions or other text patterns.

NLog did support custom event properties since the early days, which lays the foundation for a more fluent capturing of those that has been introduced in version 4.5. We do no longer have to put bulky literal dictionary definitions into our logging statements, but instead can use named placeholders (as opposed to ordinal ones as before and also known from String.Format(...) and similar) which can read as simple as:

Notice the named placeholder {result}

When this structured log message is processed by theMicrosoft.ApplicationInsights.NLogTarget adapter internally, it automatically puts all custom event properties right into the baseData.properties bag which, is meant to contain any custom event/trace data that will be stored in the AI analytics database and can later be used for doing complex reportings of the analytics data.

In the log query console of Application Insights you can then easily define conditions right on the actual log data, instead duck typing any unstructured textual data. Check #2 ✅

Summary

My first impressions of the Application Insights adapter for NLog is quite good. It’s actively maintained by Microsoft, covers several advanced aspects by default and can be effortlessly integrated to existing systems.

CRM Online does arbitrarily reduce batch request size / How to intelligently adjust batch size of ExecuteMultipleRequest when request limit is hit

As most of you know, yesterday the Microsoft Azure platform and several of its services/resource types like VSTS and Dynamics 365 were affected by outages and connectivity issues.

I have been affected by this since I was performing regression and penetation tests on a Azure-hosted integration system to a Dynamics 365 system which had its go-live last week. The aforementioned outages manifested as miscellanous network connectivity issues/timeouts and several CRM organization services not responding.

However, one effect caught my attention:

In our custom developed CRM/ERP integration system we make heavy use of ExecuteMultipleRequests and thus, of course, know all restrictions, particularities and limitations inside out. Especially regarding the maximum batch size (ImportSetting.BatchSize), I thought to be aware of. To be more precise, CRM Online by default has a fixed limit of 1000 Organization Requests that may be — simply said — “bundled” into a single ExecuteMultipleRequest and then are executed together in a single physical request to the CRM organization.

Yesterday however, I noticed that many ExecuteMultipleRequests suddenly began to raise service faults saying that the maximum batch size is exceeded which turned on the alert lamps in my mind. Since I conducted the tests and the used fixtures/data by myself and thus know them, and the fact that we used a maximum of 999 requests per ExecuteMultipleRequest, I could surely exclude the reason for these faults to be on our side.

This leads me to the conclusion, the Microsoft could automatically decrease the maximum batch size limit in Dynamics 365 Online organizations in situations where they need to reduce pressure/resource consumption in their cloud landscape. I did not find similar reports on the interweb yet, but will keep this in my backhead for clarification at given time.

Did you encounter a similar behaviour?

Solution

As a solution I wrote a simple proof-of-concept for a mechanism that “intelligently” lowers the number of organization requests put into a single ExecuteMultipleRequest when it attempts a service fault related to MatchBatchSize transgressions. Funny detail: It needs no privileged user account for retrieving a deployment setting but instead uses the “MaxBatchSize” value contained in the service fault detail data object.